Documentation
About The Visualization
US Military Deaths by Cause 1980-2010 is an interactive data visualization created with the D3.js JavaScript library. It is a visual representation of the dataset “U.S. Military Deaths by cause 1980-2010”. The dataset lists the number of deaths for each year in eight different categories. In designing the visualization my intent was to depict the breakdown of the total number of deaths in a given year and uncover any trends in the data.
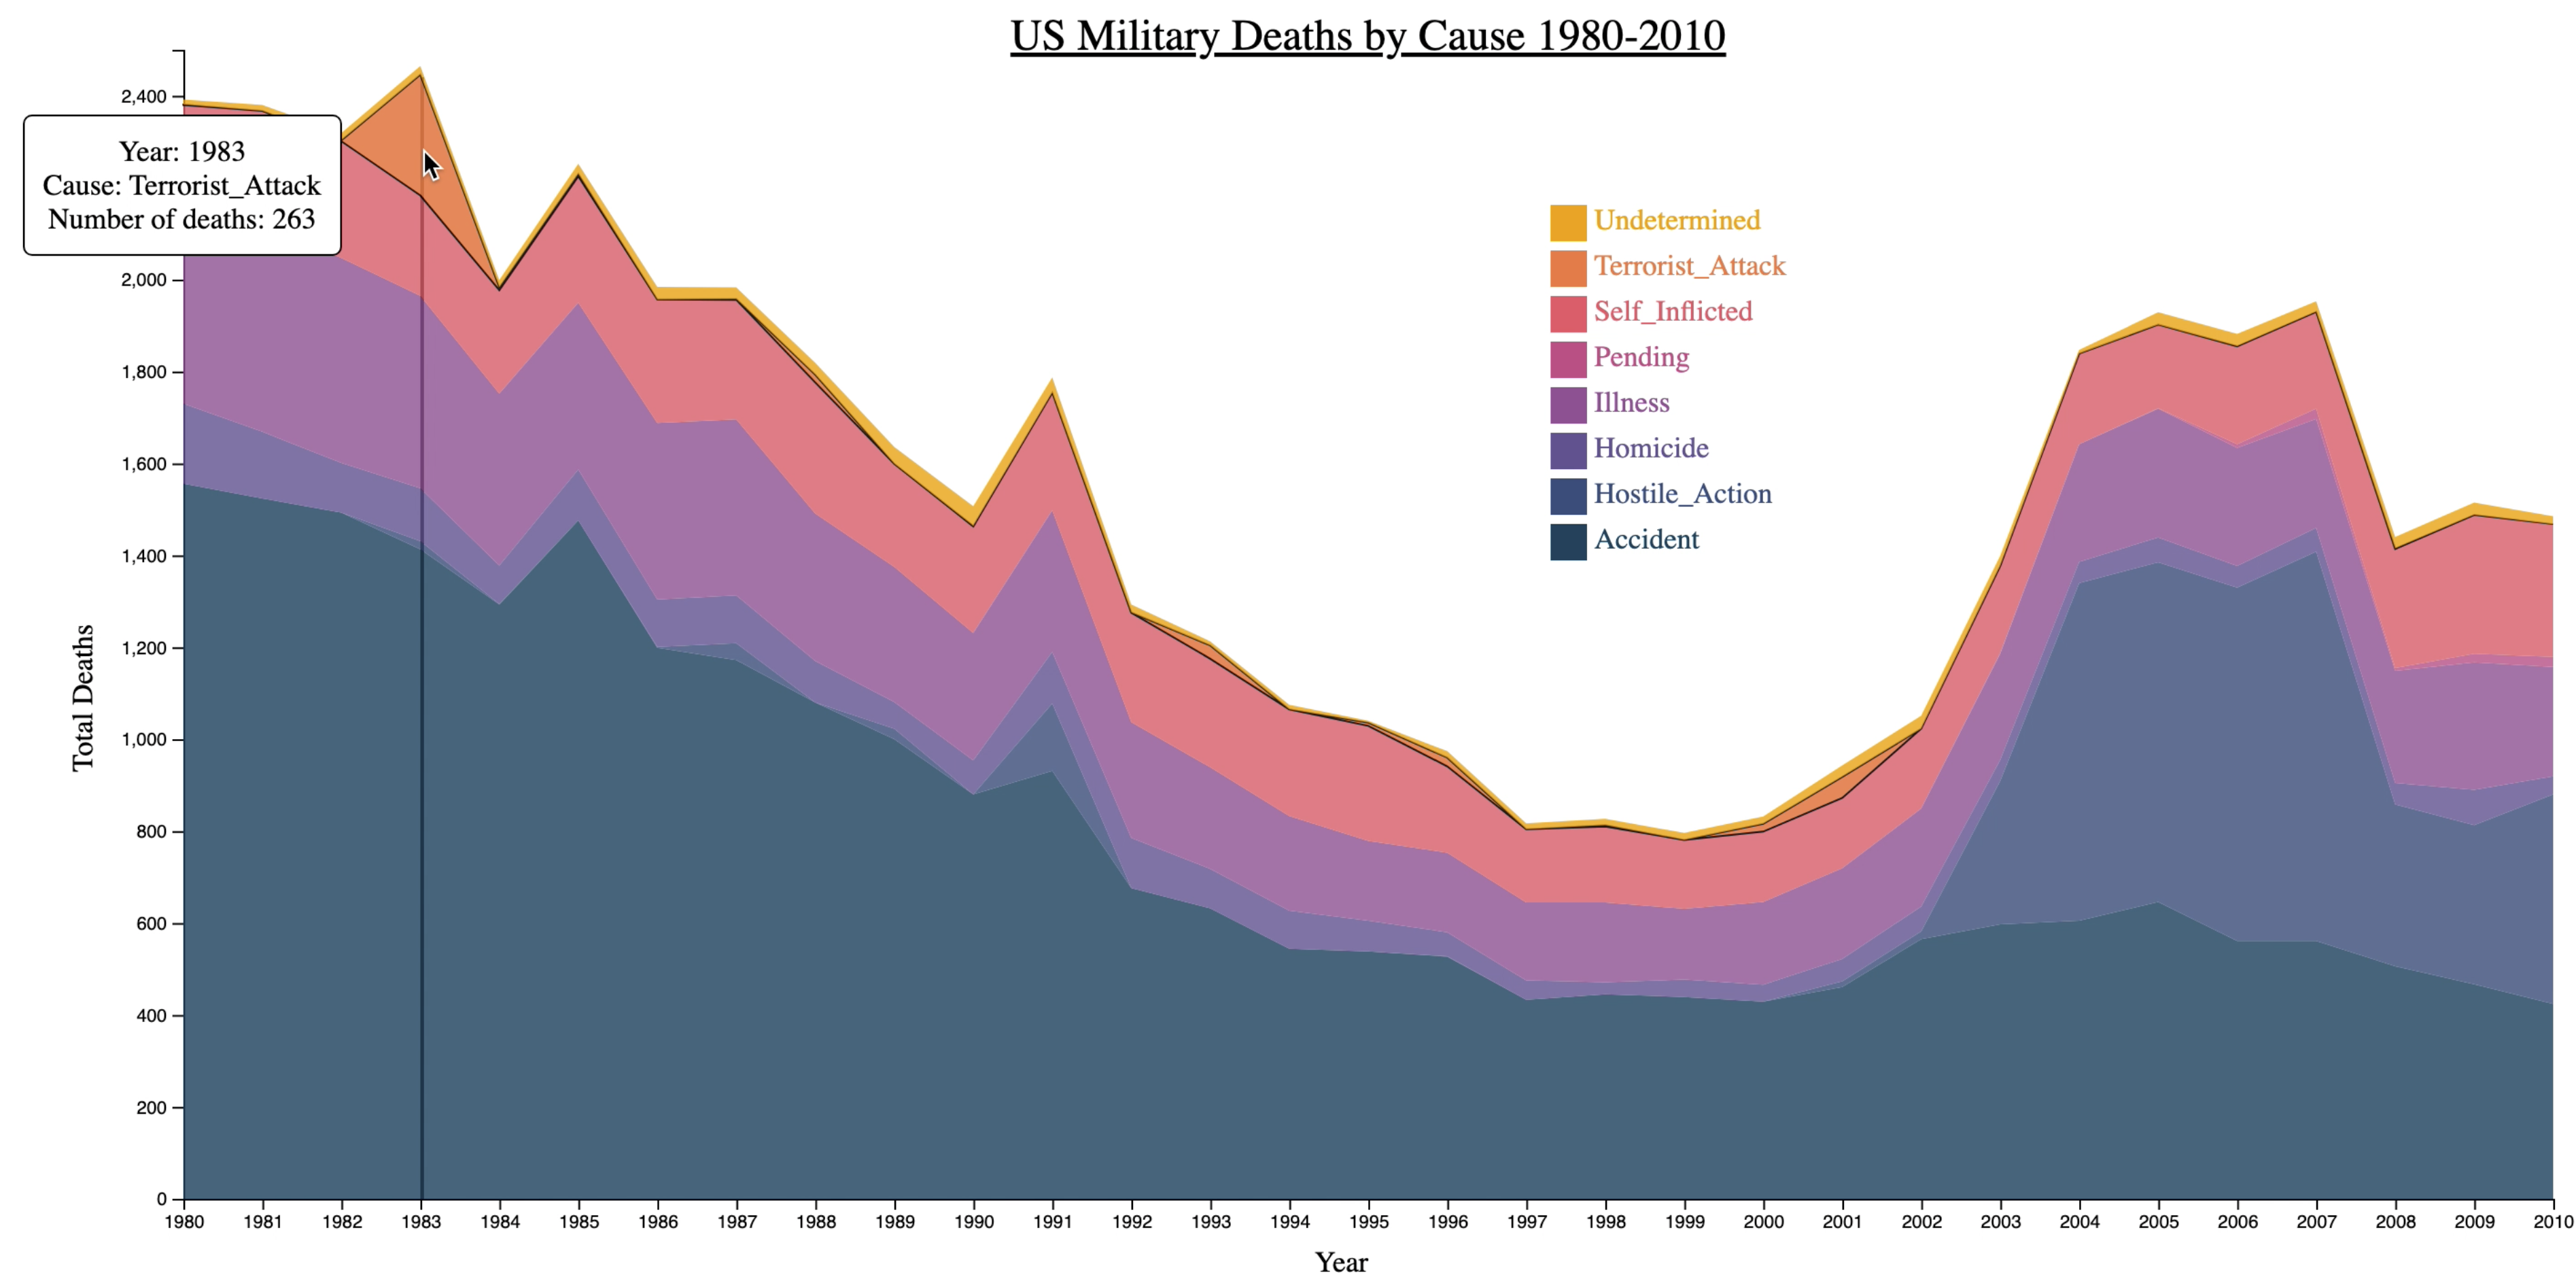
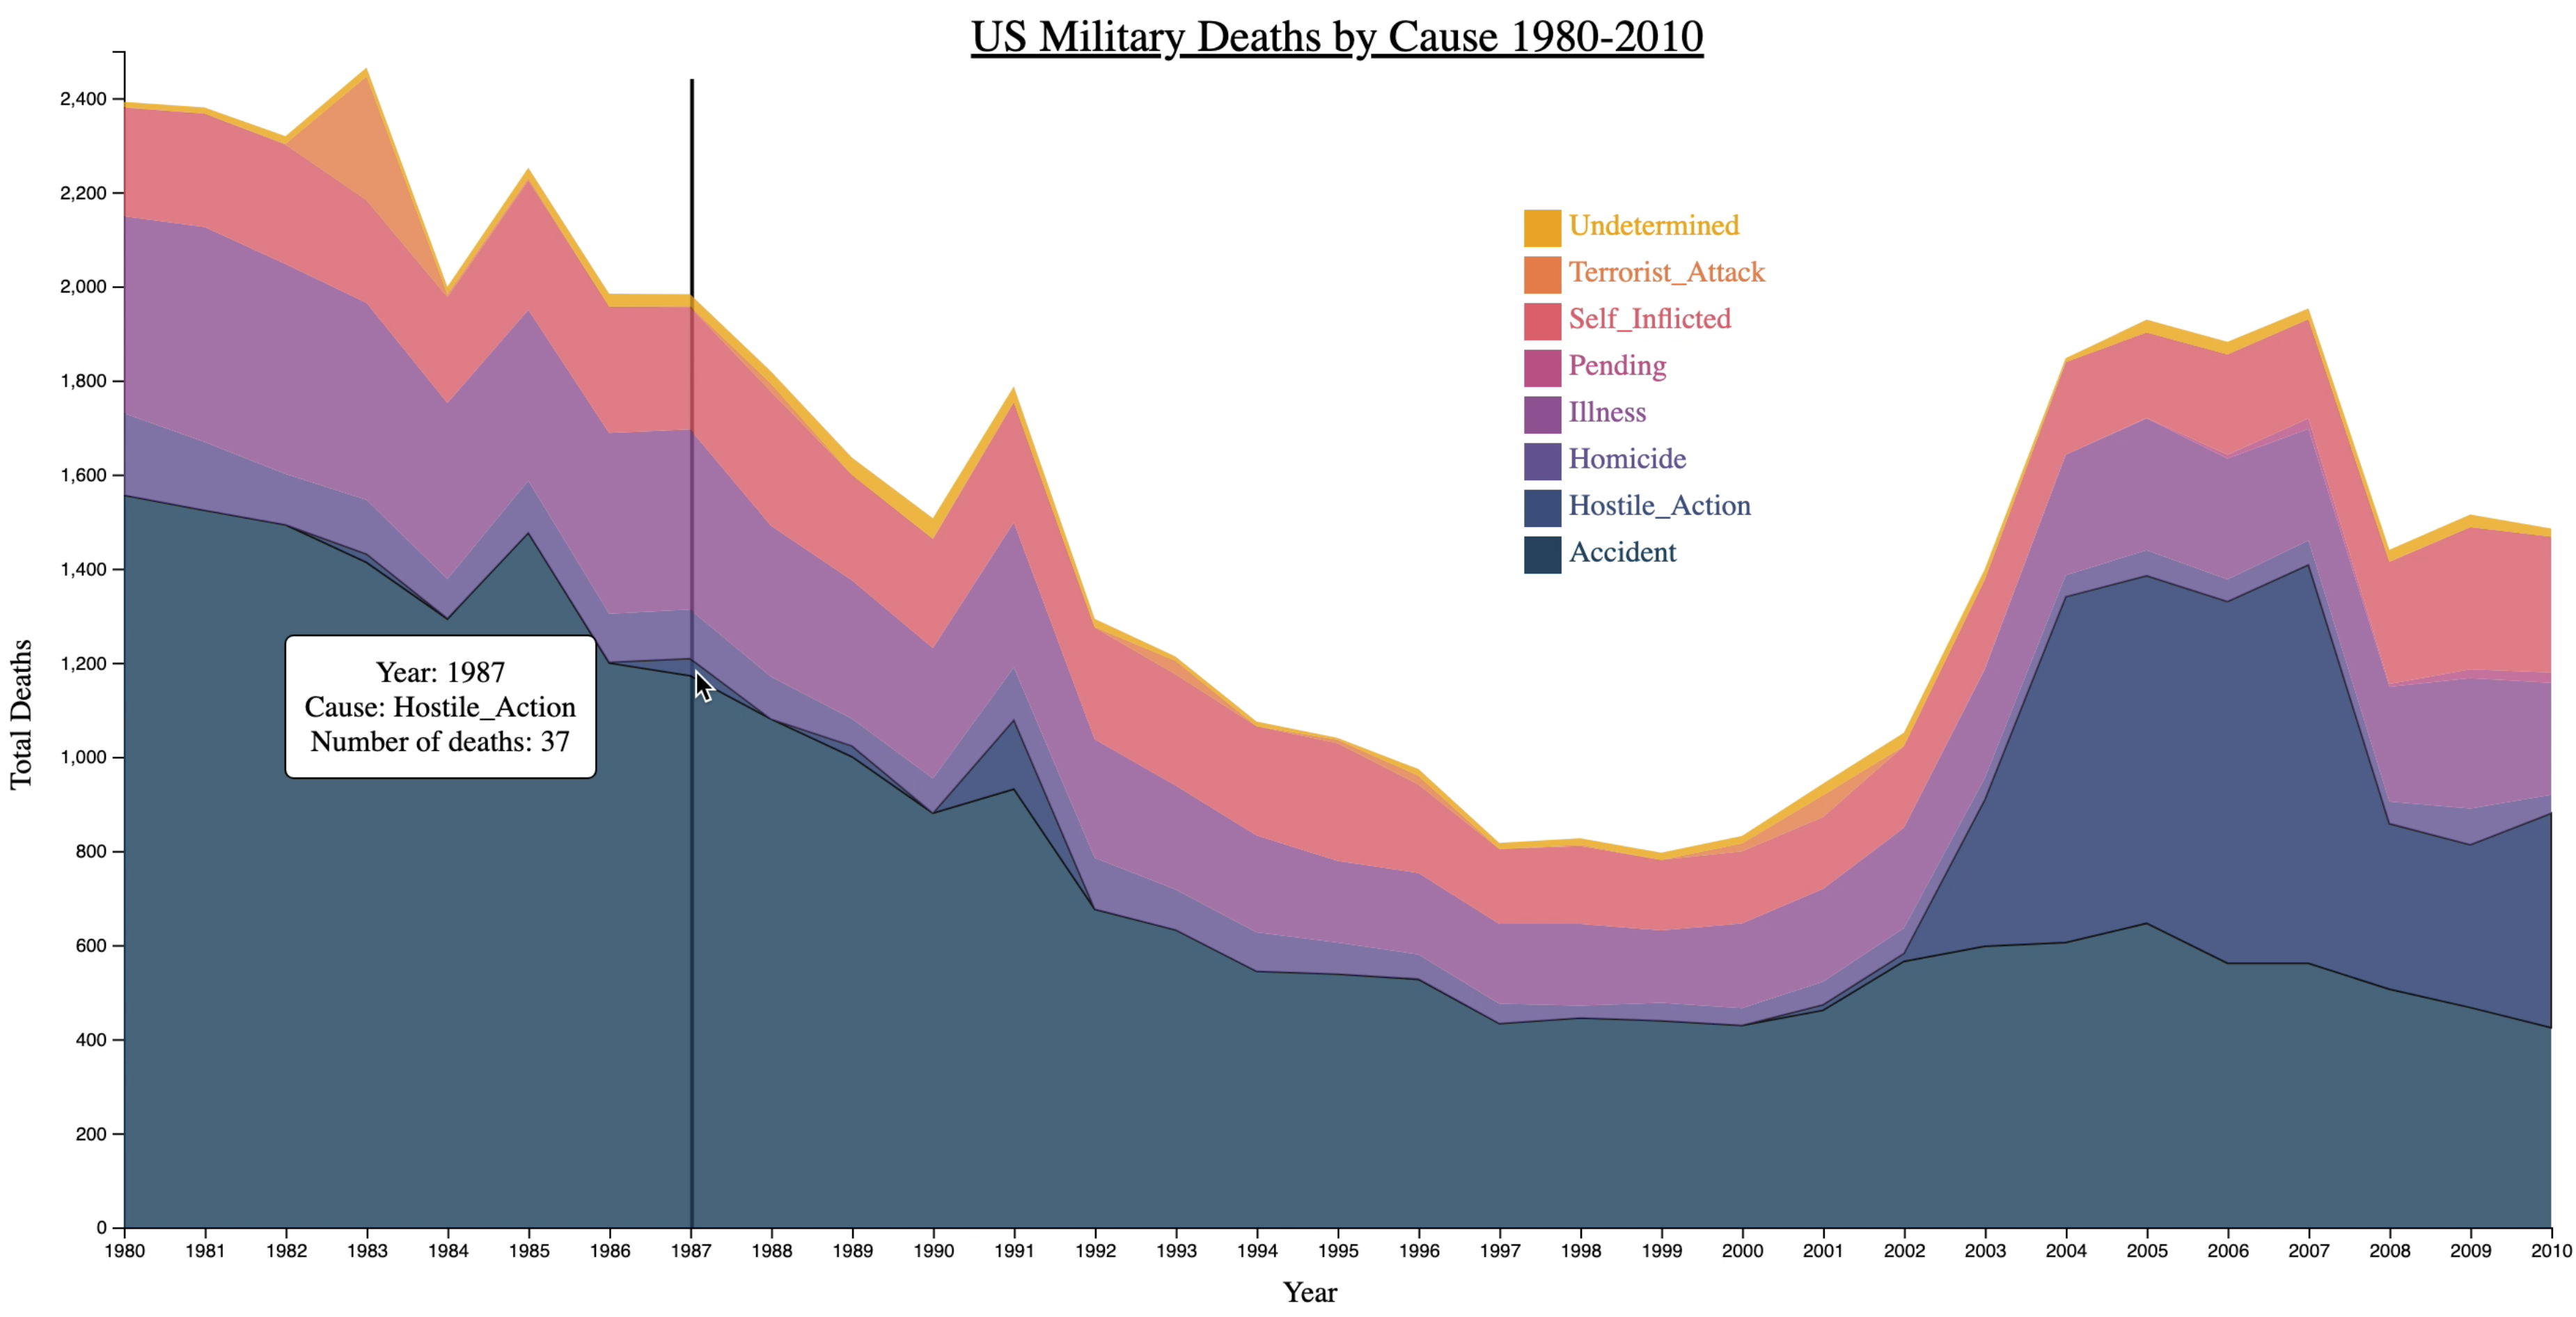
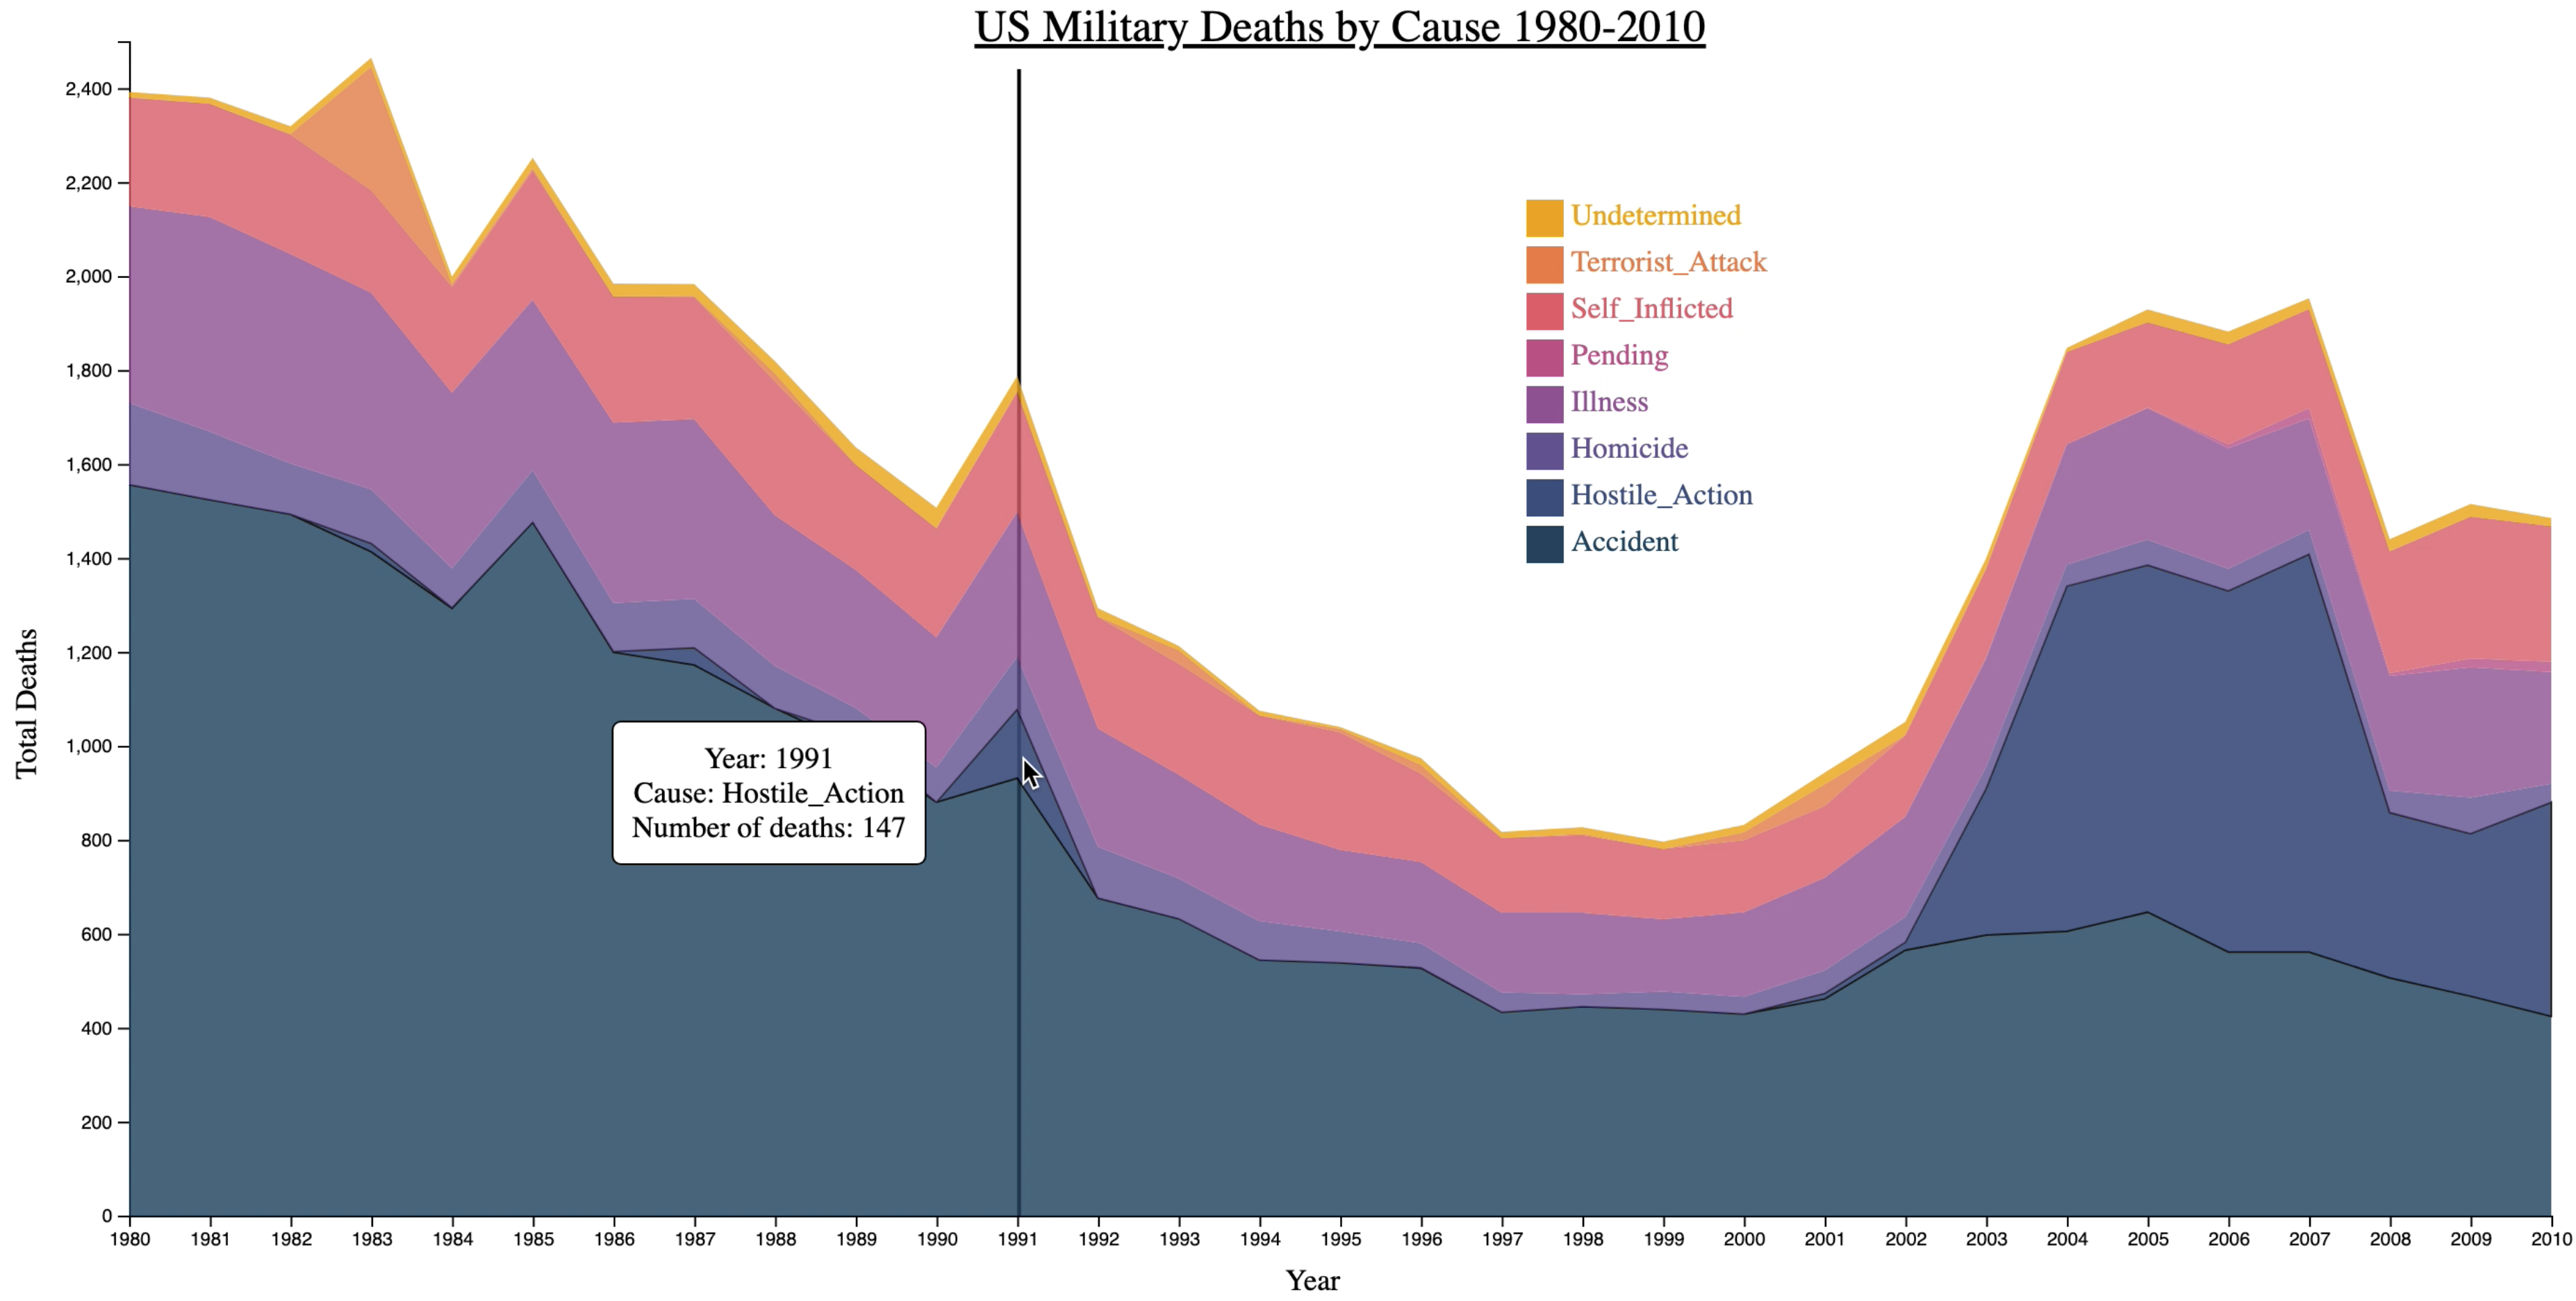
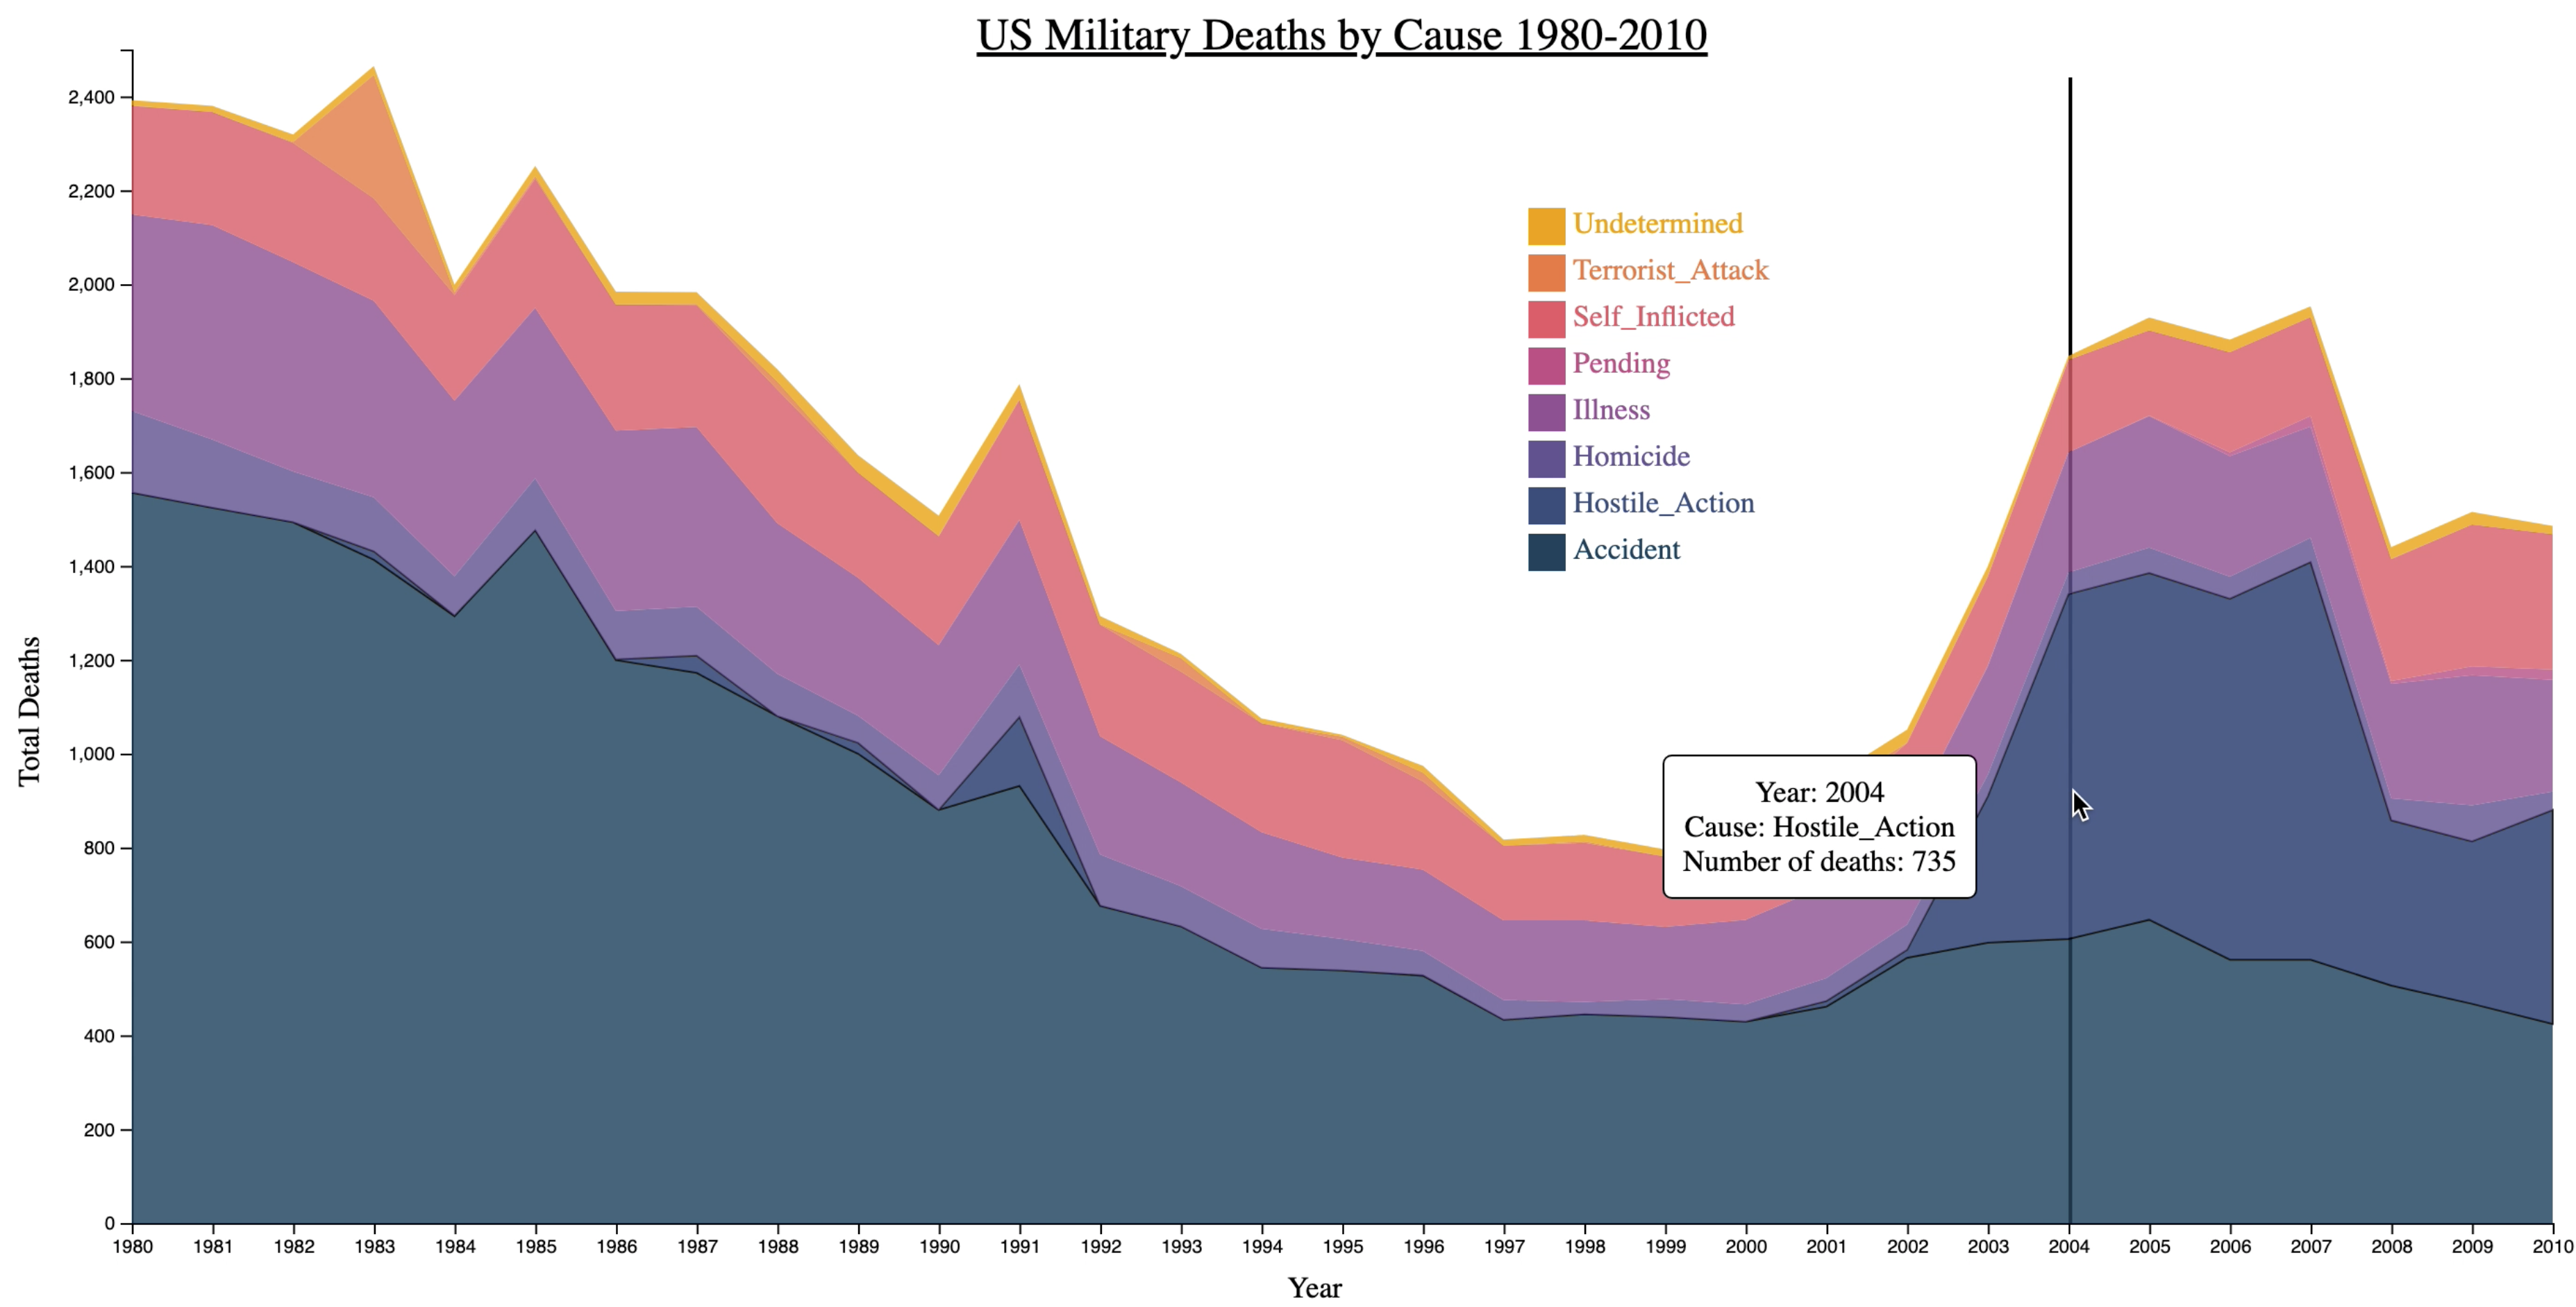
I used a stacked area chart to represent the dataset with the year along the x-axis and total deaths along the y-axis. Cause of death is represented by color with the value of each cause stacked with each other cause to reach the total number of deaths that year

My initial design included the total number of military size for each year and showed each cause of death subtracted from the total military size for that year. Since the total number of deaths each year is a relatively small portion of the total military size in a given year this resulted in a y-axis scale that made it difficult to decern the difference between causes of death.

The stacked area chart alone does not provide context to what the colors represent. My first solution for this was to add an interactive tooltip such that when users hover their mouse over any data in the visualization they receive details about what that data is.

However the tooltip is only useful when users are interacting with the visualization and I felt there needed to be a clear explanation as to what the colors represent. Therefore after choosing a more consistent color palette for the visualization I included a legend to associate each color with a cause of death.

Beirut Barracks Bombing
The first discovery I made was a large spike in deaths attributed to terrorist attack in the year 1983. 263 deaths are by far the most attributed to terrorism for a single year in this dataset. Further research revealed this tragic event to have been caused by a truck bomb detonated near a Marine barracks in Beirut, Lebanon.

wikipedia.org/wiki/1983_Beirut_barracks_bombings (opens in new window)
USS Stark Incident
Of all the causes of death for US military personnel in this dataset, being killed by the enemy in combat (i.e., hostile action) is relatively low for most years. In fact outside of major periods of war many years have zero deaths attributed to hostile action. One exception to this is the 37 servicemembers killed in 1987 when an Iraqi jet attacked the frigate USS Stark.

wikipedia.org/wiki/USS_Stark_incident (opens in new window)
Gulf War
A spike in the total number of deaths in 1991 can be attributed to the 147 lives lost to hostile action in the Gulf War.

wikipedia.org/wiki/Gulf_War (opens in new window)
Iraq War
Hostile action because the leading cause of death for US military personnel for the first time in this dataset in 2004 during the second year of the Iraq War.

wikipedia.org/wiki/Iraq_War (opens in new window)
Additional Information
d3js.org (opens in new window) - D3.js JavaScript library
kaggle.com/datasets/toomuchsauce/us-military-deaths-by-cause (opens in new window) - Dataset